Overview
Introduction
What is the Mapsted Analytics API?
The Mapsted Analytics API is an interface by which you can access analytical data from your deployed core location technology. The API is organized into several modules for easy integration.
Positioning Analytics API: The Positioning Analytics API provides non-real-time position-related analytics data. These APIs include data related to maps/floorplans, sessions, users, trajectories, and more.
Real-Time Analytics API: The Real-Time Analytics API provides real-time position-related analytics data. These APIs include data related to current locations, recent heatmaps, check-in/out data, and more.
CSV Analytics API: The CSV Analytics API provides non-real-time position-related analytics data written in CSV format. These APIs are less dynamic than the Positioning Analytics APIs, but they may be useful for scenarios where data is desired to be accessed as a one-off rather than based on continuous integration.
General Analytics API: The General Analytics API provides several generalized utility APIs.
Zone Geofence Analytics API: The Zone Geofence Analytics API provides CRUD methods (create, read, update, and delete) for managing zone geofences.
Engagement Analytics API: The Engagement Analytics API provides data related to user engagement with the mobile-sdk and/or app.
Marketing Analytics API: The Marketing Analytics API provides marketing-related analytics data. This includes, but is not limited to, trigger analysis, and campaign statistics.
Insights Widget Analytics API: The Insights Widget Analytics API provides a set of APIs which power the insights widget for displaying trajectory information, dwell locations and times, and more.
Widgets Analytics API: The Widgets Analytics API provides a set of APIs which are designed to provide specific data visualizations, plots, tables, or graphs. This includes, but is not limited to, heatmap densitites, user traffic flows, user usage information, device usage information, common keyword searches, and zone geofence analyses.
Boost Analytics API: The Boost Analytics API provides a set of APIs associated with boost data, including heatmaps, traffic-flows, network usage, comfort insights, and more.
BTags Analytics API: The BTags Analytics API provides a set of APIs associated with boost tag data, including trajectories, heatmaps, traffic-flows, and more.
Mapsted Key Terms
This section will go over some key terminology that is unique to our products, to make it easier for you to get started with the Mapsted Maps Mobile Framework.
Properties, Buildings, and Floors
Each venue is referred to as a Property, which consists of one or more Building structures. Each of these Building structures contains one or more Floor structures. The Property establishes a relationship between related buildings. For reference, a visualization of the Property, Building, and Floor structures can be seen in the Figure below.
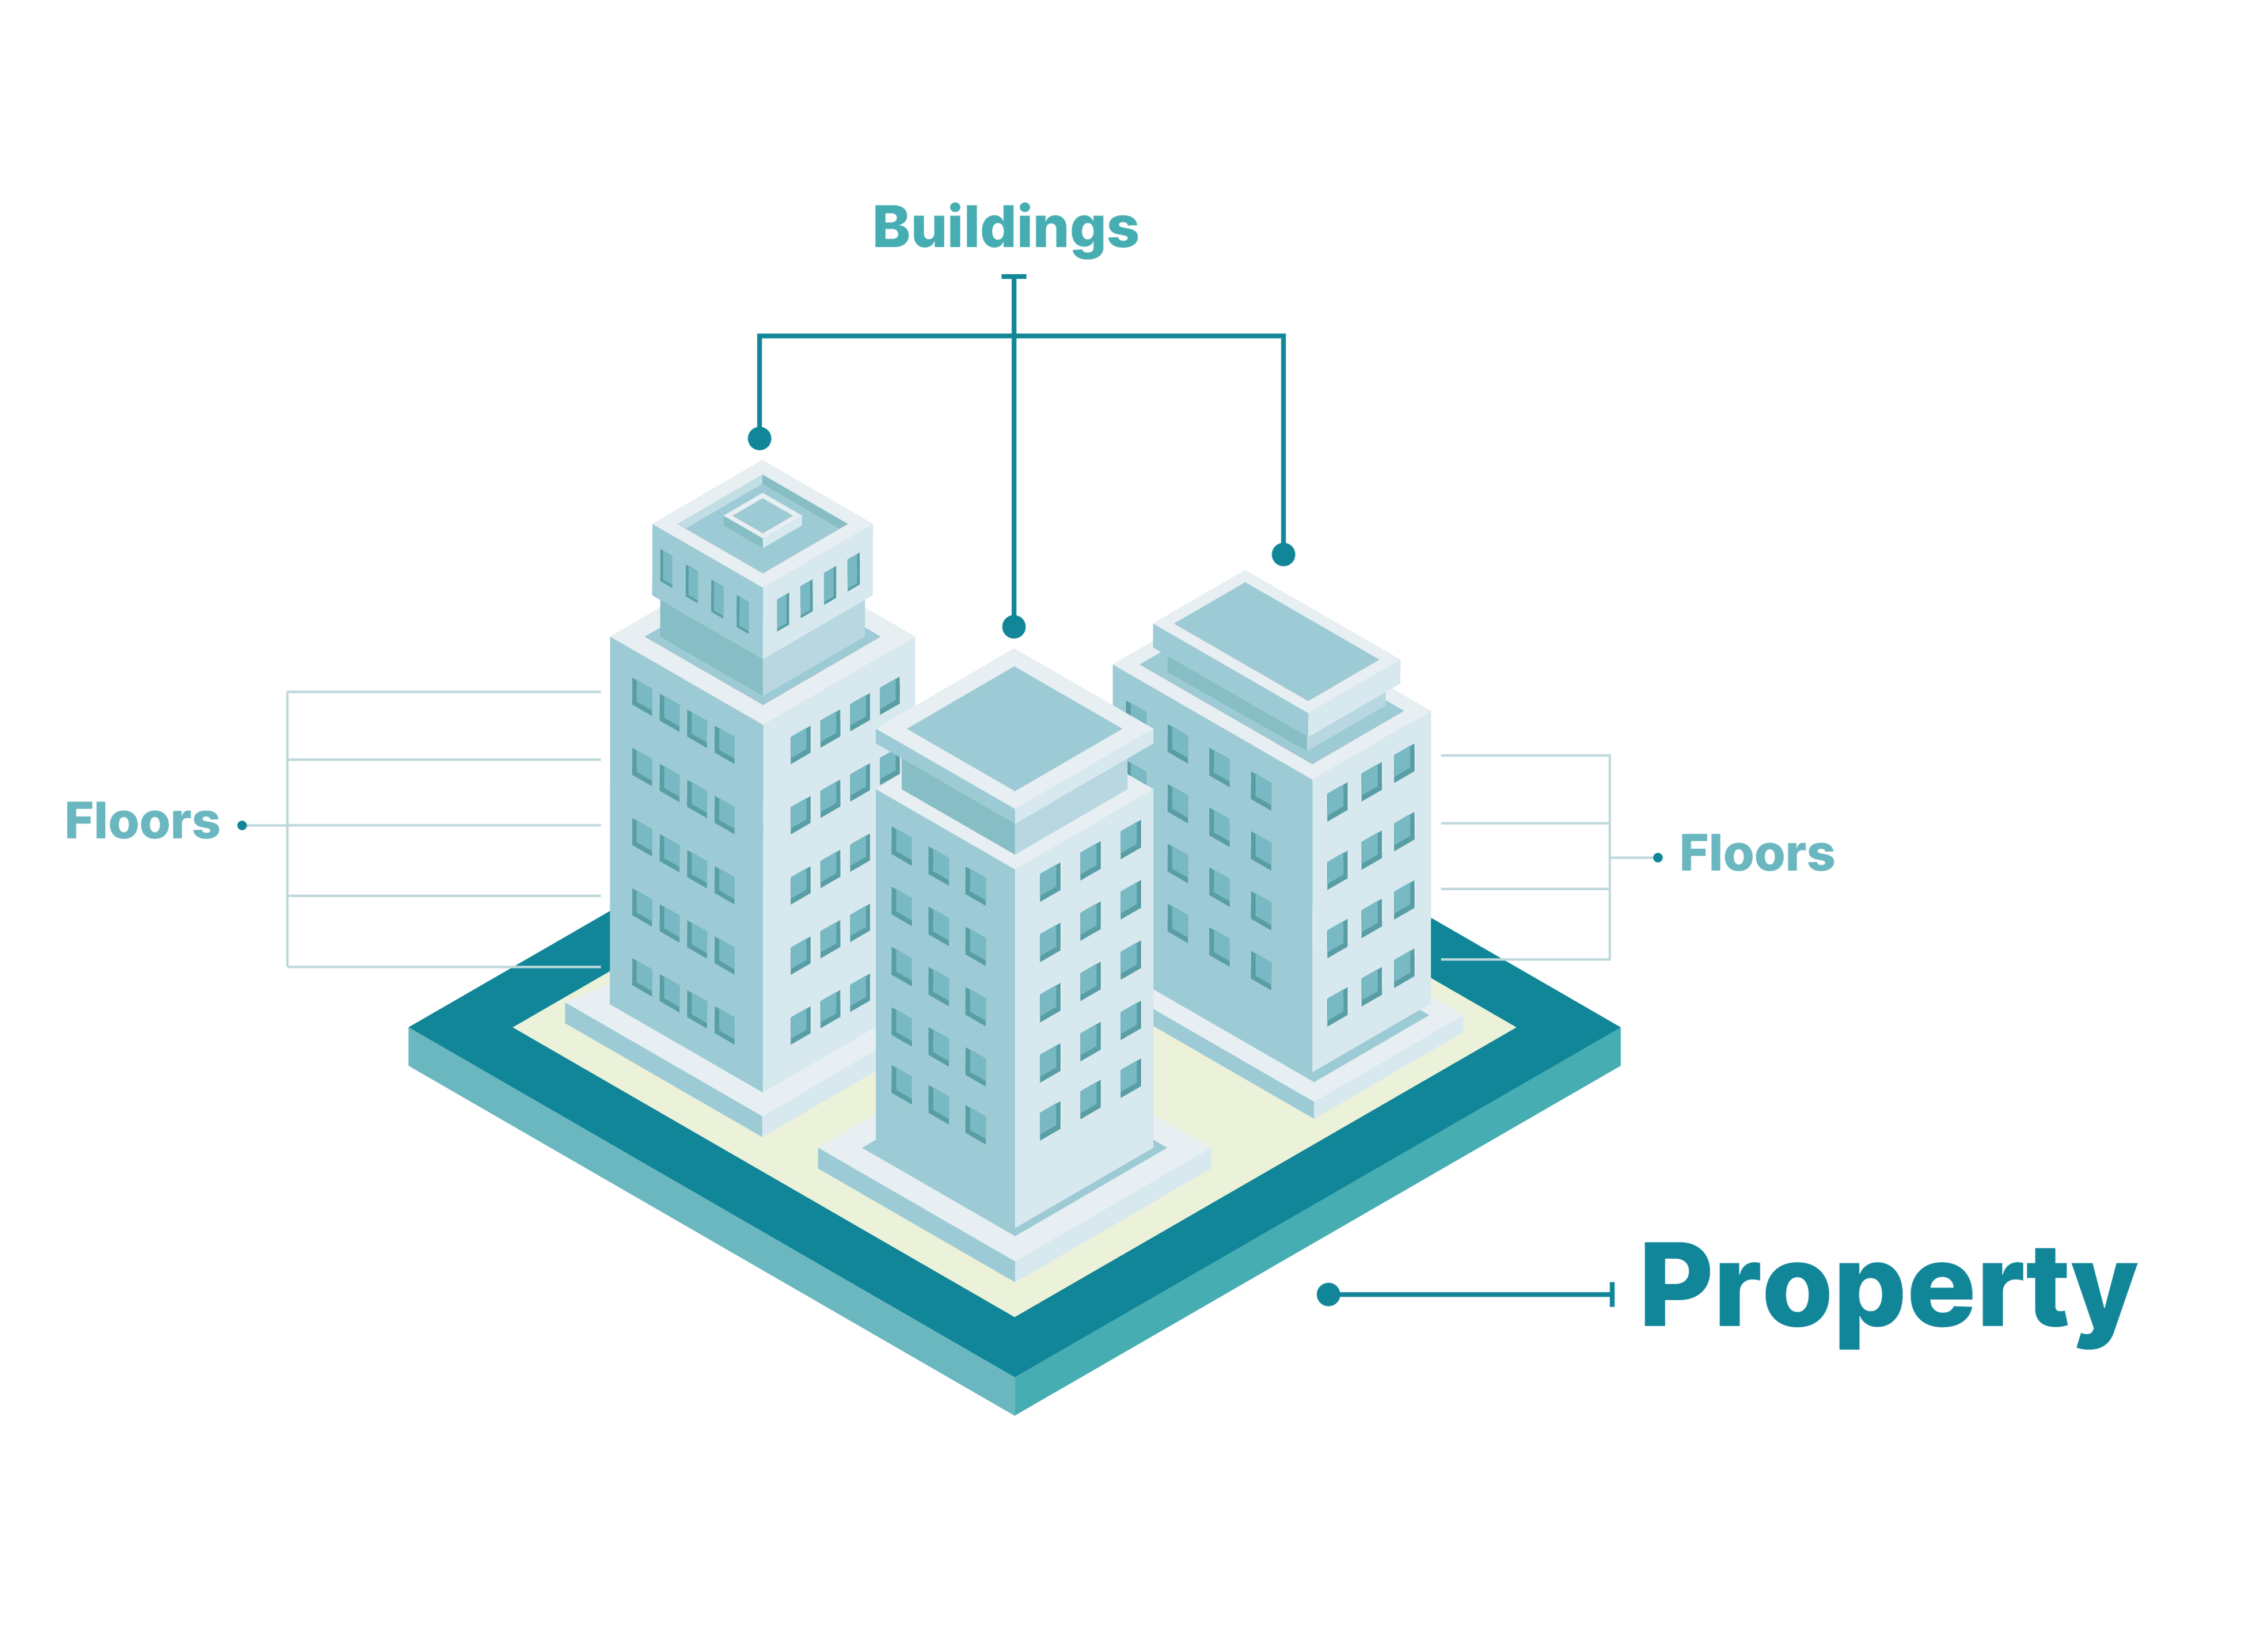
Each Property is identified by a PropertyId, each Building is identified by a BuildingId, and each Floor is identified by a FloorId. The PropertyId, BuildingId, and FloorId are unique across the Mapsted system.
Entities
An Entity is a fundamental element within a Property or Building. An Entity consists of a geometry type (i.e., MapPolygon, MapPolyline, MapPoint), a physical interpretation (e.g., Structure-Building, Structure-Room, or Obstacle-Wall), and at least one Category (e.g., Restaurant). One Entity can be associated with multiple categories, but each Entity will have one main Category.
Please see the figure below for a visualization of the Entity structure. Note that an Entity which is on the property-level (e.g., a building, parking garage, park, pond) is found in the PropertyEntities, and an Entity which is on the building-level (e.g., a room, elevator, wall) is found in the BuildingEntities.
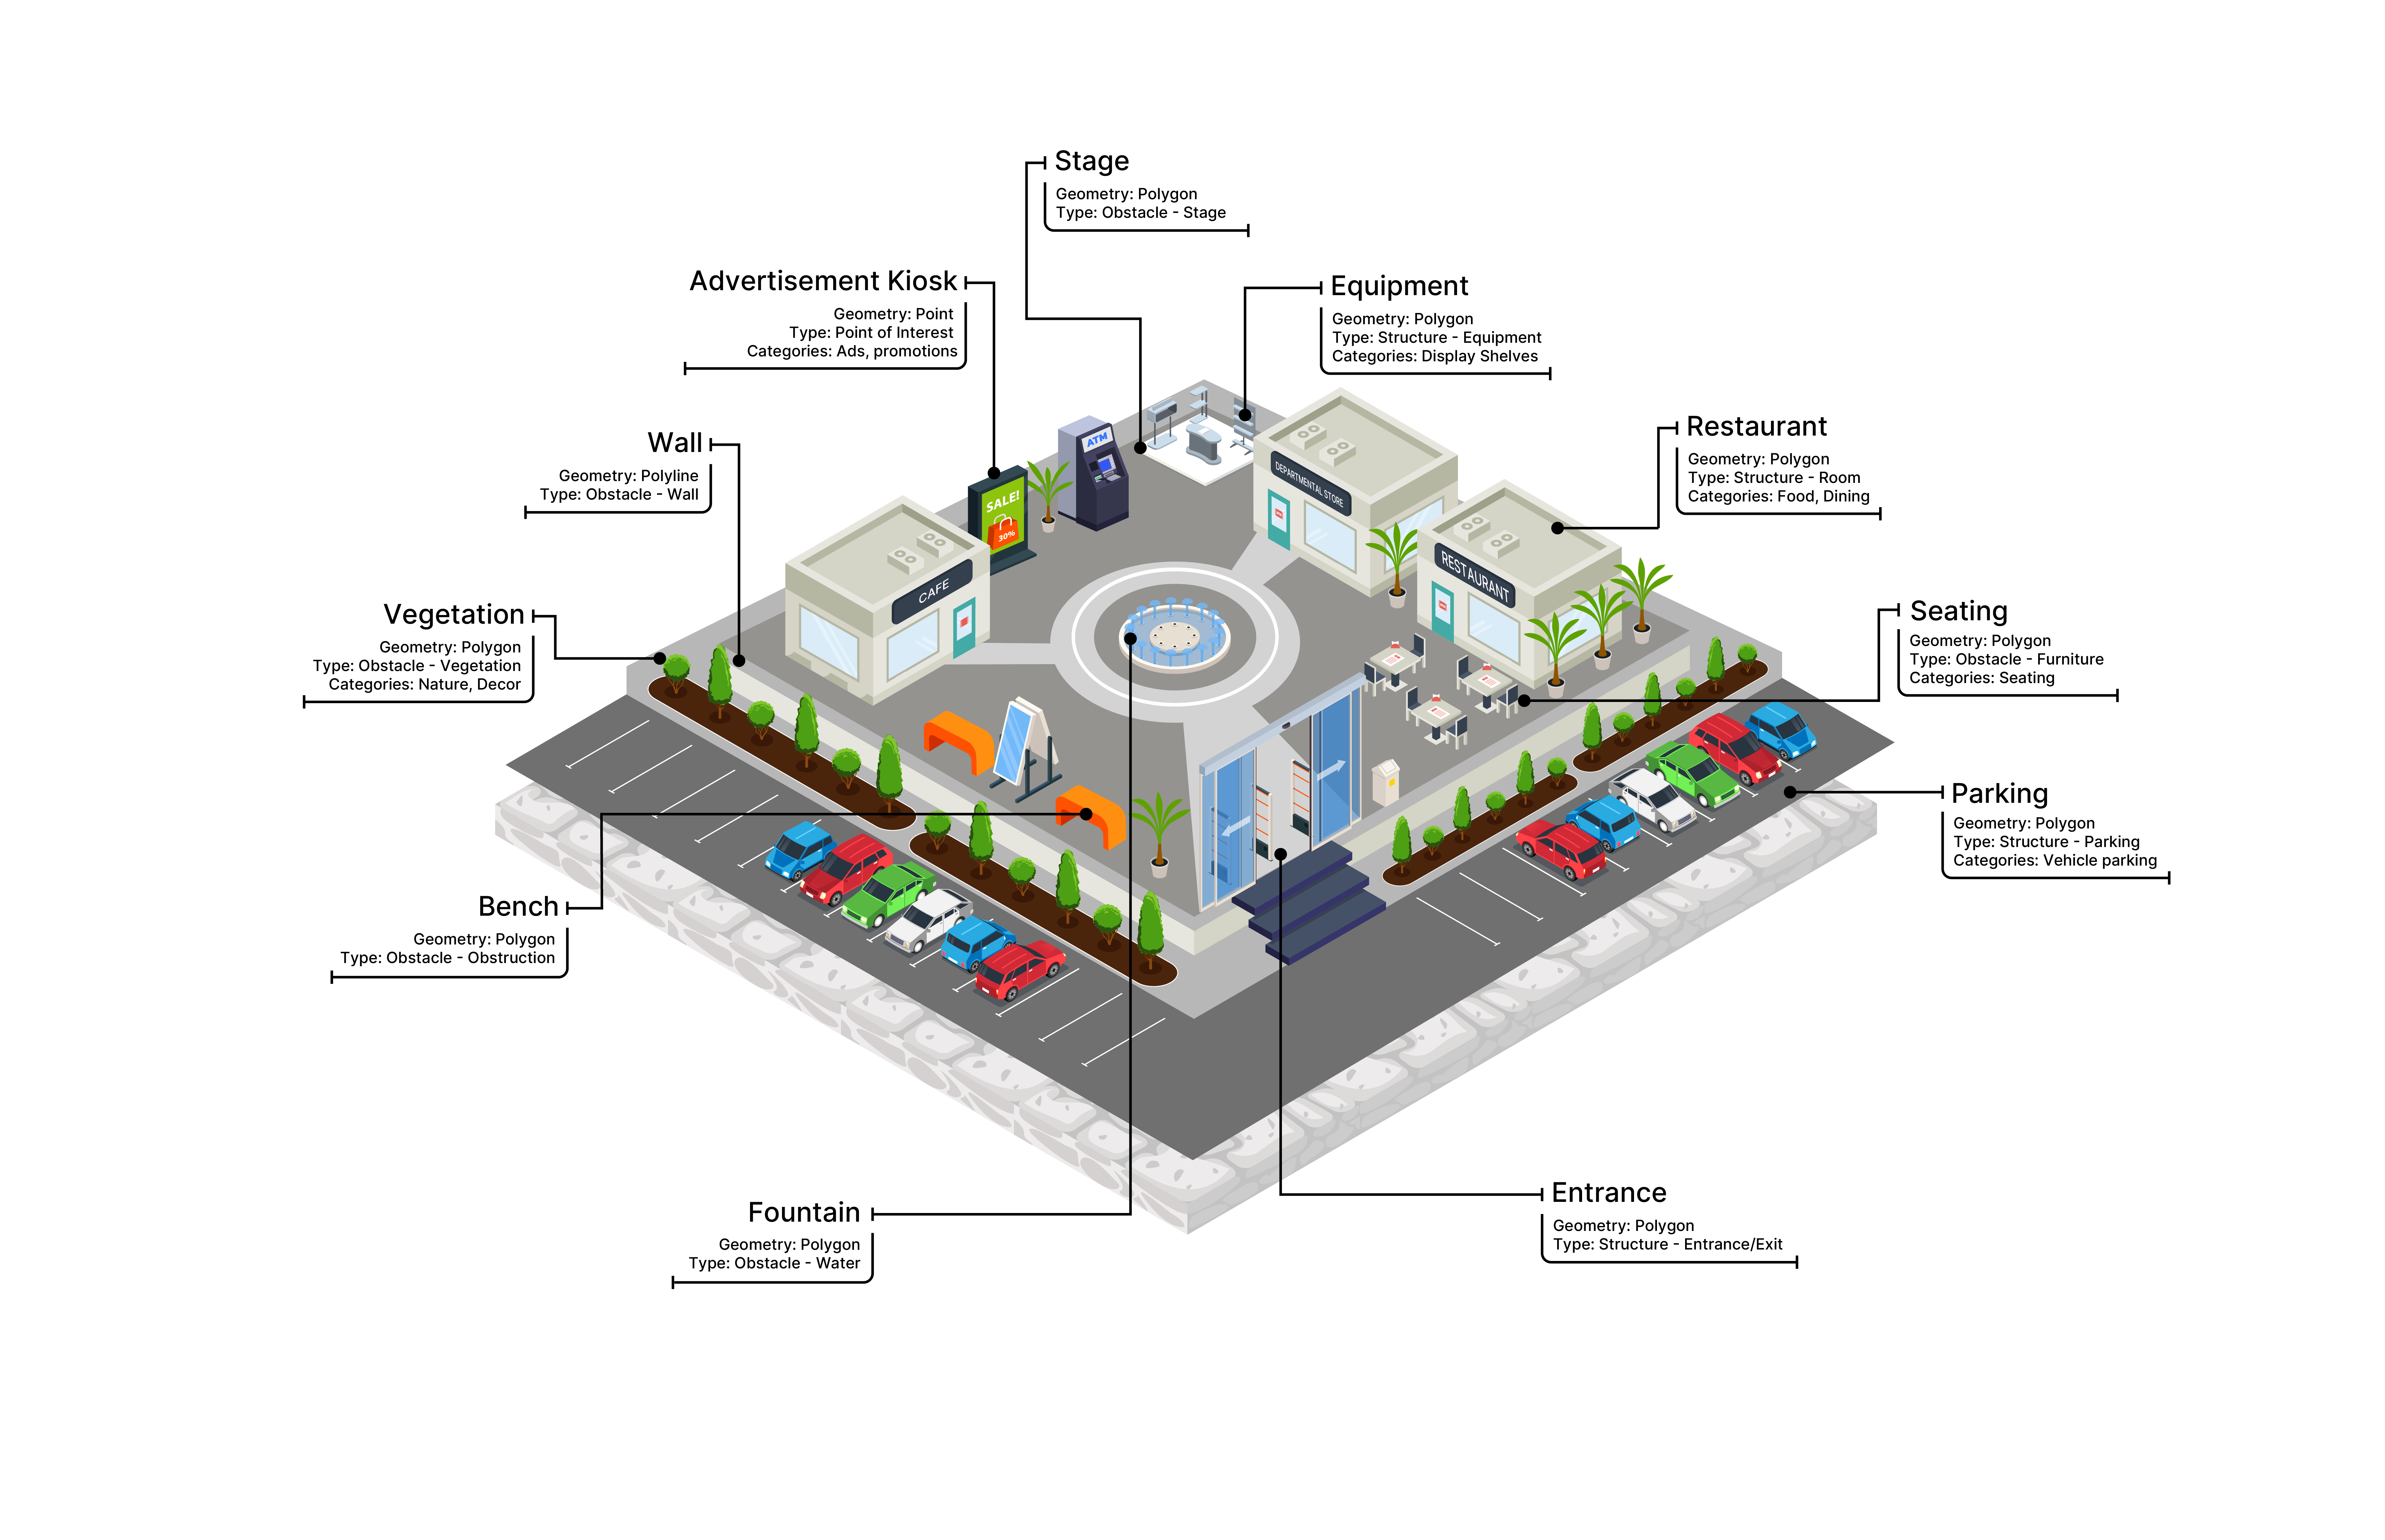
Each Entity is identified by an EntityId, and depending on the geometry type, will have an associated PolygonId, PolylineLineId, or PointId. Note that EntityId and corresponding geometry type id are only unique within their scope. This means that for PropertyEntities, the EntityId will be unique to that particular Property. In the case of BuildingEntities, the EntityId will be unique to that Building.
Analytics Terminology
Session: A session refers to a single usage of the mobile app or SDK. It begins when the app/SDK is launched and it ends when the app/SDK is closed/stopped. It is represented by a Session UID.
User Visit: A UserVisit describes a user's trajectory through a property which consists of collection of TrajectorySegment and TrajectoryTransition objects, as shown below.

Positioning Analytics
Positioning Analytics outlines a set of APIs which can be used to retrieve positioning-related analytical data. Typically, these are organized on a per-Property or per-User basis.
Property Analytics
Property analytics provide a description of aggregated user activity for a specific property during a specific time span.
User Analytics
User analytics provide a description of user activity during a specified time span.
User Visits
A user visit represent a user's trajectory. Consists of a list of TrajectorySegment, TrajectoryTransition, and ZoneGeofenceVisits.
Trajectory Segment
A trajectory segment represents a segment of the user's trajectory for a given zone (i.e., propertyId, buildingId, floorId).
Trajectory Transition
A trajectory transition represents the transition timespan when a user transitions from one zone to another zone (i.e., propertyId, buildingId, floorId).
Zone Geofence Visits
A zone geofence visit represents a list of the predefined Zone Geofences that a user has traversed during their Session.
Mobile Analytics
Mobile Analytics outlines a set of APIs which can be used to retrieve mobile usage-related analytical data.
Map Analytics
Map analytics provides insights on how the user interacted with the map. This can include, but is not limited to, which entities the user selected on the map, added to itinerary, and/or requested navigation to.
Search Events
Search events provide insights on user interests by analyzing their keyword searches.
Route Requests
Route requests provides insights on user behaviour by analyzing the destinations that they requested a route to.
Screen Changes
Screen changes provides insights on the flow with which the user interacts with the mobile application.
Background Events
Background events provides insights on when the user was interacting with the mobile application in the foreground vs. background.
Marketing Analytics
Marketing Analytics outlines a set of APIs which can be used to retrieve marketing/Notify usage-related analytical data.
Triggers
Marketing trigger events identify when a trigger was activated and identifies the corresponding marketing campaign.
Events
Marketing Events identify when a campaign-based advertisement was shown to a user. This also indicates the method by which it was shown to the user (e.g., pop-up, push notification), as well as the user's interaction (e.g., dismiss, request route, view map/feed/website, like, share).
Widgets
Our Widgets outline a set of APIs which can be used to retrieve data designed for use with specific widgets that offer various different data visualizations, plots, tables, or graphs.
Heatmap Widget

The heatmaps widget allows you to easily see where your visitors are spending the most time. It also allows you to easily identify key pass-by and dwell areas.
Visitor Widget
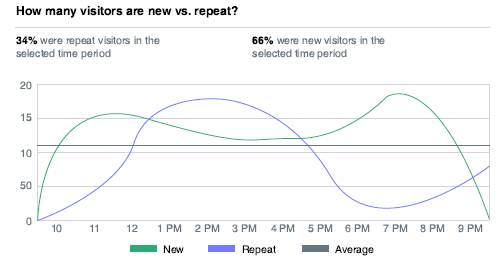
The visitor widget allows your to easily visualize new vs. repeat users.
Hardware Widget
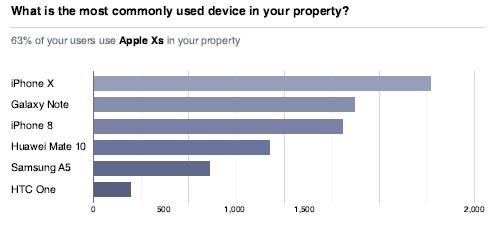
The hardware widget allows your to easily view a breakdown of the types of devices that are being used. As well, it includes a the ability to visualize other aspects, such as the types of screen resolutions, service providers.
Trajectory Flow Analysis Widget

The trajectory flow analysis widget allows your to easily analyze the most common flows that visitors take through your property (e.g., enter via Entrance 2, pass by food court, take escalator up).
Zone Geofence Flow Analysis Widget
The zone geofence flow analysis widget allows your to easily analyze the most common Zone Geofence flows that users take through your property.